
Graphical User Interface#
The movement graphical user interface (GUI), powered by our custom plugin for
napari, makes it easy to view and explore movement
motion tracks. Currently, you can use it to
visualise 2D movement datasets
as points, tracks, and rectangular bounding boxes (if defined) overlaid on
video frames, to manually correct tracking errors,
and to define regions of interest (RoIs).
The napari plugin is shipped with the movement package starting from
version 0.1.0. To use it, you need to
install the package with a method that
includes the napari dependency.
Launch the GUI#
To launch the movement GUI, type the following command in your terminal:
movement launch
This is equivalent to running napari -w movement and will open the napari
window with the movement widget docked on the
right-hand side, as in the screenshot below.
In napari, data is typically loaded into layers,
which can be reordered and toggled for visibility in the layers list panel.
For example, keypoint data can be added as a
points layer or a tracks layer,
while image stacks (including videos) can be added as
image layers.
Below, we’ll explain how to do this.
Load a background layer#
Though this is not strictly necessary, it is usually informative to
view the keypoints overlaid on a background that provides
some spatial context. You can either load the video
corresponding to the dataset, or load a single image (e.g., a still frame derived from that video).
You can do this by dragging and dropping the corresponding video or image file onto the
napari window or by using the File > Open File(s) menu option.
Load a video#
Upon loading a video file into napari, you will be prompted
via a pop-up dialog to select the reader.
Choose the video reader—corresponding to the
napari-video
plugin—and click OK. You can optionally select to remember this reader
for all files with the same extension.

napari-video will load the video as an image stack with a slider
at the bottom that you can use to navigate through frames.
You may also use the left and right arrow keys to navigate
frame-by-frame.

Clicking on the play button will start the video playback at a default
rate of 10 frames per second. You can adjust the playback speed by right-clicking on the
play button, or by opening the napari > Preferences menu
(File > Preferences on Windows) and changing
the Playback frames per second setting.
Video playback limitations
The video playback may freeze or stutter if you jump to a specific frame while the video is playing. We recommended pausing the playback first.
napari-videomay struggle to play videos at a high frame rate, depending on your hardware, the video resolution and codec. If you experience performance issues, such as the video freezing or skipping frames, try reducing the playback speed or fall back to using a single image as a background.
Load an image#
This usually means using a still frame extracted from the video, but in theory you could use any image that’s in the same coordinate system as the tracking data. For example, you could use a schematic diagram of the arena, as long as it has the same width and height as the video and is properly aligned with the tracking data.
Extracting a still frame from a video
You can use the command line tool ffmpeg
to extract a still frame from a video.
To extract the first frame of a video:
ffmpeg -i video.mp4 -frames:v 1 first-frame.png
To extract a frame at a specific time stamp (e.g. at 2 seconds):
ffmpeg -i video.mp4 -ss 00:00:02 -frames:v 1 frame-2sec.png
Dragging and dropping the image file onto the napari window
(or opening it via the File menu) will load the image
as a single 2D frame without a slider.
Load tracked data#
Now you are ready to load some motion tracks over your chosen background layer.
On the right-hand side of the window you should see
an expanded Load tracked data menu. You can load data from
one of the supported third-party formats
or from a netCDF file saved with movement
(expand the dropdown below for the precise requirements).
netCDF files compatible with the GUI
Only netCDF files that store a valid movement dataset can be opened in the GUI. Practically, this means:
The dataset’s
ds_typeattribute must be set toposesorbboxes.The data variables, dimensions, and coordinates must satisfy the dataset structure requirements for that
ds_type. For example, aposesdataset must provide bothpositionandconfidence.
Below is a small example showing how to save a GUI-compatible
netCDF file with movement:
from movement.io import load_dataset
from movement.filtering import rolling_filter

ds_orig = load_dataset(
    "path/to/my_data.h5", source_software="DeepLabCut", fps=30
)

# Create a copy to avoid modifying the original dataset
ds_new = ds_orig.copy()

# Apply some processing to the position data variable.
# e.g. a rolling median filter
ds_new["position"] = rolling_filter(
    ds_orig["position"], window=5, statistic="median"
)

# Save the processed dataset to a netCDF file
ds_new.to_netcdf("my_data_processed.nc")
Because ds_new is copied from the original dataset, it retains all required
attributes and structure. Note that the data variable remains named position
after processing, as expected.
To load tracked data in napari:
From the
source softwaredropdown menu select the name of the tracking software you used to generate the data (e.g. “DeepLabCut”), or choose “movement (netCDF)”.Set the
fps(frames per second) of the video the data refers to. This only changes the time units shown when you hover over a keypoint. An unknownfpscan be set to1, which makes the displayed time equal to the frame index. Thefpsoption is disabled when loading a netCDF file because thefpsis directly read from the file’s attributes.Specify the file containing the tracked data. You can paste the path to the file directly in the text box, or click
Browseto use the file browser.Click
Load.
The data will be loaded into the viewer as a points layer and as a tracks layer. If the input file is a bounding boxes dataset, an additional napari shapes layer is loaded. By default, the data is added at the top of the layer list and the points layer is selected.
For a poses dataset, you will see a view similar to this:

And for a bounding boxes dataset, you will see a view more like the one below:

Note the additional bounding boxes layer that is loaded for bounding boxes datasets. For both poses and bounding boxes datasets, you can toggle the visibility of any of these layers by clicking on the eye icon.
The points layer#
The points layer shows the data for the current frame.
The keypoints are represented as points, colour-coded by keypoint for single-individual datasets, or by individual for multi-individual datasets. In datasets with one keypoint per individual, or no keypoint dimension, the points are always colour-coded by individual.
With the points layer selected,
if we enable the display_text option in the
layer controls panel, the keypoint name will be displayed on the lower right corner of each point. If the
dataset has no keypoint dimension, the individual name is shown instead.
Hovering with your mouse over a point
(with the points layer selected) will
bring up a tooltip containing the properties of that point: the individual and keypoint it represents,
the point-wise confidence score (provided by the source software),
and the time in seconds (calculated based on the frame number and
the fps value).

Using the frame slider at the bottom of the window, you can move through the frames of the dataset, and the points and video (if loaded) will update in sync.
Changing markers size, colour and shape
You can change the size, the colour and the shape of any selected markers using the points layer controls panel.
You can use the following keyboard shortcuts to toggle the markers selection:
To select all the markers in the current frame, press
A.To select all the markers in all the loaded frames, press
Shift + A.To unselect the currently selected markers, press the relevant keyboard shortcut again.
You can find all the keyboard shortcuts in the top menu of the
napari window, under Preferences > Shortcuts.
The tracks layer#
The tracks layer allows us to visualise data before and after the current frame. Remember that the current frame is determined by the position of the frame slider.
The trajectory made up of all positions of a keypoint on all frames before the current frame is called tail. Similarly, its trajectory on all frames after the current frame is called head.
Both tail and head tracks are represented as lines connecting a single keypoint across frames. The colour of the tracks follows
the colour of the markers, and the length of the tracks can be adjusted in the
tracks layer controls panel, with the tail length and head length sliders.
When the tail length slider is at its maximum position, the tail track show the trajectory of the
keypoints from the start of the video until the current frame. When the head length slider is at its maximum position,
the head track shows the trajectory of the keypoints from the current frame until the end of the video.
For example, in the screenshot below, we can see from the tracks layer control panel that the selected layer shows the trajectories of the keypoints from the current frame until the end of the video.

You can also use the tracks layer controls panel to change the colormap of a selected tracks layer.
Some caveats regarding the tracks layer
Currently there is no support in
naparifor fine control over the length of the tail and head tracks. However, we are working on a workaround, stay tuned!Also note that currently the
show IDcheckbox in the tracks layer controls panel refers to an internal napari track ID, rather than the individual or the keypoint ID. This is a known issue and we are working on a fix or workaround.
The boxes layer#
The boxes layer is loaded for bounding boxes datasets only. It shows the bounding boxes for the current frame, as rectangles color-coded by individual.
The name of the individual is shown in the lower left of the bounding box by default. This can be toggled by selecting the shapes layer in the layer list and clicking the display text checkbox in the layer controls panel.
As with tracks and points, you can use the frame slider at the bottom of the viewer to move through the frames of the dataset. This will update the bounding boxes and the rest of the loaded data in sync.
Changing bounding box size, colour and shape
You can change edge and face colour as well as the positions of a bounding box’s corner vertices using the shapes layer controls panel.
You can use the following keyboard shortcuts to toggle the bounding boxes selection:
To select all the bounding boxes in the current frame, enable the select shapes tool (
5orS) and pressA.To deselect, click off of the bounding boxes.
Individual vertices can be selected instead of the entire rectangle using the select vertex tool:
4orD.
You can find all the keyboard shortcuts in the top menu of the
napari window, under Preferences > Shortcuts.
Edit tracked data#
Pose estimation models occasionally produce errors such as mis-localised
keypoints and false-positive detections in the background, which automated
post-processing (e.g. filtering or interpolation)
cannot fully resolve.
The movement GUI lets you correct these prediction errors by interactively
editing the keypoints on the
points layer created when you
load the tracked dataset.
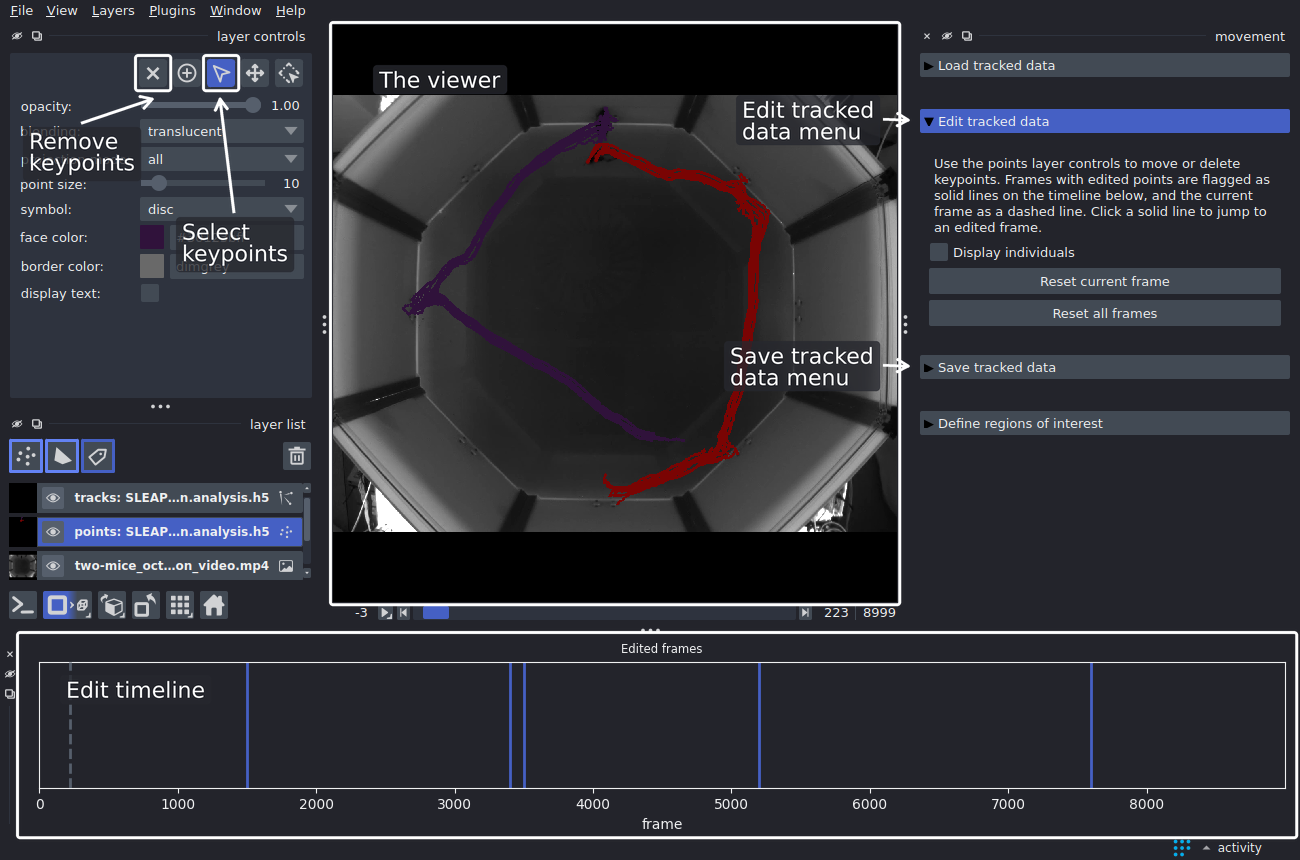
Editing involves the following parts of the GUI:
The viewer, where you select and edit keypoints on the points layer.
The select and remove buttons in the layer controls panel, which let you pick keypoints and delete them. Adding new keypoints is not yet supported.
The
Edit tracked datamenu on the right-hand side of the window, which holds the editing options and the buttons to reset edits. Expanding or collapsing it shows or hides the edit timeline.The edit timeline at the bottom of the window, which provides a visual summary of all edited frames and lets you navigate to them.
The
Save tracked datamenu, which lets you save your changes to a file.
Warning
Editing is currently supported for poses datasets only. While the keypoints in bounding boxes datasets are editable, saving any changes is not yet supported and will result in an error.
Select keypoints#
To start editing:
Select the points layer in the layer list.
Use the frame slider to go to the frame you want to correct.
In the layer controls panel, activate the Select points tool (the arrowhead icon, or press
Sor3).
With the Select points tool active, you can select keypoints directly in the viewer using one of the following methods:
Click a keypoint to select it.
Hold
Shiftwhile clicking to select multiple keypoints.Drag a selection box to select a group of keypoints.
Note
Editing is disabled whenever the frame slider is controlling a non-time dimension, e.g. after changing the order of the viewer axes or switching to 3D view. Return to the 2D view with time as the leading axis to re-enable editing.
Edit types#
When you edit a keypoint, the Edit tracked data menu expands and the
edit timeline appears at the bottom of the window.
The timeline shows a solid line for the frame you edited, and a dashed
line for the current frame. The tracks layer
updates automatically to stay in sync with the points layer, so trajectories
always reflect the current keypoint positions.
Move keypoints#
To move the selected keypoint(s), drag them to the correct position.
Moved keypoints are shown as rings. Their confidence is set to NaN, because the model’s score no longer applies.
Once a keypoint is moved, a boolean edited property is added to all points in the layer: it is True for moved keypoints and False for all others. Hover over a point to check: a moved keypoint’s tooltip shows edited: True.
Remove keypoints#
To remove the selected keypoint(s), click the ✕ icon in the layer controls
panel, or press Delete, Backspace, or 1.
Removed keypoints disappear from the viewer, and their confidence scores are
set to NaN.
Edit timeline#
The edit timeline spans all frames of the dataset in the currently selected
movement points layer, and shows a solid vertical line for every frame
containing at least one edited keypoint.
A dashed line marks the current frame displayed in the viewer and
moves with the frame slider as you navigate through the frames.
You can interact with the timeline as follows:
Action |
Effect |
|---|---|
Click a solid line |
Go to the corresponding edited frame |
Scroll up / down |
Zoom in / out, centred on the cursor (e.g. to tell apart the lines of adjacent frames) |
Click and drag |
Pan along the timeline (when zoomed in) |
Double-click |
Reset the view to show all frames |
For datasets with multiple individuals, tick the Display individuals
checkbox in the Edit tracked data menu to split the timeline into one
row per individual. Each row’s lines match the colour of that individual’s
points, showing which individuals were corrected in which frames.
The checkbox is disabled for single-individual datasets.
Reset edits#
If you want to discard your corrections, the Edit tracked data menu
provides two buttons:
Reset current framereverts all edits made to keypoints in the frame currently shown in the viewer. Edits in other frames are kept.Reset all framesrestores all edited keypoints in the loaded dataset. You will be asked to confirm before the edits are discarded.
Both buttons restore the dataset to the state it was in when you loaded it into the viewer. This means that if you resumed an editing session from a saved file, the edits already saved in that file are kept, and their keypoints are still marked as edited. Resetting does not change the file on disk, unless you save them.
Save edits#
To save your edits to a file:
Select the
movementpoints layer that contains the edits in the layer list.Expand the
Save tracked datamenu and clickSave(enabled only when amovementpoints layer is selected).In the dialog that opens, choose a location and enter a file name. The data is currently saved in
movement’s native netCDF format.
The saved file contains a valid movement poses dataset with:
the corrected
positionvalues; removed keypoints are stored asNaN;the
confidencevalues, with all edited keypoints stored asNaN;a boolean
editeddata variable, with dimensions(time, keypoint, individual), storingTruefor every edited keypoint andFalsefor all others.
The edited variable is included only if at least one keypoint was edited.
Keypoints or individuals that end up with no data in any frame
(e.g. because all their points were removed) are dropped from the saved
dataset. Frames are never dropped: a frame whose points were all removed
is kept, with NaN values.
To resume editing later, load the saved
.nc file in the GUI: all previous edits are restored, so you can pick
up exactly where you left off.
Tip
Because the edits are saved in the edited variable, you can use them in
your analysis, for example to report how many keypoints were corrected by
hand, or to compare results with and without the corrected frames.
See Native saving and loading with netCDF for how to load the file in Python.
Define regions of interest#
The Define regions of interest menu allows you to draw shapes on the
viewer and use them as movement RoIs for analysis.
Each shape you draw represents a static region that remains fixed across all frames.
Terminology
- Shape
Any geometric object you draw on the
naparicanvas (e.g. a polygon or a line). Shapes are grouped together innaparishapes layers.- Region
A named
naparishape thatmovementrecognises as aA named
naparishape thatmovementrecognises as anRoIfor analysis.- Region layer
A
naparishapes layers managed bymovement, whose shapes are treated as regions.
Create a region layer#
To define a region for your data, start by creating a region layer, which will serve as a container. To do this:
Ensure a background layer is loaded so that you can see where you are drawing.
Expand the
Define regions of interestmenu on the right-hand side of thenapariwindow.Click the
Add new layerbutton.
This will create a new region layer in the layer list and select it.
The layer also appears in the dropdown next to the Add new layer button.
The layer’s default name is regions, but you can change it by double-clicking
on it in the layer list (this is the case for any napari layer).

Draw and edit regions#
With the region layer selected, you can use the native napari shape tools
in the layer controls panel to draw shapes on the canvas.
Convenient keyboard shortcuts are available to select the shape drawing tools,
for example:
R: rectangle toolE: ellipse toolP: polygon toolL: line tool
Tools are also provided for selecting, moving, transforming, and deleting shapes, as well as for editing their vertices. Hover over any tool button to see a tooltip describing what it does. You can also copy-paste shapes within a layer. See the napari shapes layer guide for details on the drawing tools and how to use them.
Each shape you draw is automatically added to the widget’s table of regions
on the right-hand side and auto-assigned a unique name
(e.g. region, region_1, region_2, etc.).

You can interact with the table in the following ways:
Select: clicking a row in the table selects the corresponding shape on the canvas, and vice versa. This makes it easy to identify which shape corresponds to which table entry.
Rename: double-click the name cell of a region to edit its name. Press
Enterto confirm the change orEscapeto cancel.Delete: select a shape on the canvas and press
Delete(orBackspace) to remove it. The corresponding row will be removed from the table.
Changing shape appearance
You can change the edge colour, face colour, edge width, and opacity of
shapes by selecting a shape (or multiple shapes)
and using the napari layer controls panel.
Once a shape’s appearance has been adjusted, all subsequent shapes drawn in
the same layer will inherit those properties by default.
To display region names on the canvas, tick the display text checkbox
in the layer controls panel. The text colour follows the shape’s edge
colour.
Save and load regions#
You can save a region layer to a GeoJSON file
and load it back later—or share it with collaborators. This also lets you
import drawn regions into your Python code using the
load_rois() function.
To save a region layer:
Select a non-empty region layer you want to save, via the dropdown or the layer list.
Click
Save layerand choose a destination file ending in a.geojson(or.json) extension. All regions in the layer are written to the chosen file.
To load a region layer:
Click
Load layerand select a GeoJSON file previously saved with themovementGUI (or any file produced bysave_rois()).A new region layer is created and automatically selected in the dropdown, with its regions shown in the table.
When regions are saved and reloaded, the underlying geometry is preserved
but the exact napari shape type may change (e.g. a rectangle reloads
as a polygon). Expand the dropdown below for details.
Using saved regions in Python
Once you have saved a region layer to a GeoJSON file, you can load it
in Python with load_rois():
from movement.roi import load_rois

rois = load_rois("path/to/regions.geojson")
This returns a list of LineOfInterest and/or
PolygonOfInterest objects, depending on the
shapes that were saved. The mapping between napari shape types and
movement RoI classes is as follows:
drawn napari shape |
movement RoI |
reloaded napari shape |
|---|---|---|
|
|
|
|
|
|
|
|
|
|
|
|
|
|
*Ellipses have no native GeoJSON representation and are approximated
as polygons. The approximation is accurate enough for most practical
purposes, but we encourage you to inspect the reloaded shape to ensure
it meets your needs. For more details on the shape-RoI conversion process,
refer to the movement.napari.convert_roi module documentation.
You can use the loaded RoI objects for analysis, for example:
Pass a list of polygon regions to
compute_region_occupancy().Call methods such as
contains_point()orcompute_distance_to()on individual RoIs.
See the movement.roi API reference for the full list of
available methods, and
this example in our gallery
for a complete walkthrough that loads GUI-drawn regions and uses them
for analysis.
Working with multiple region layers#
You can use region layers to group related regions together. For example, you might use one layer for “nesting zones” and another for “foraging zones”.
To add another region layer, click the Add new layer button again.
You can switch between region layers using the layers dropdown, or by
selecting the layer directly in the napari layer list—both are kept in sync.
The regions table updates to show only the shapes
belonging to the selected layer.