plot_centroid_trajectory#
- movement.plots.plot_centroid_trajectory(da, individual=None, keypoints=None, ax=None, **kwargs)[source]#
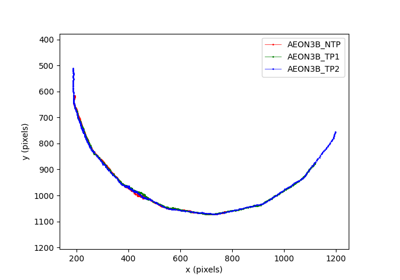
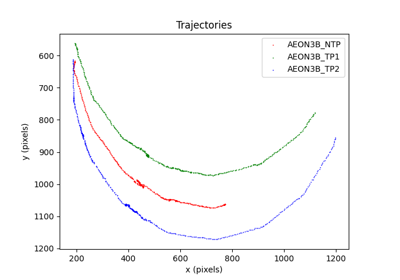
Plot centroid trajectory.
This function plots the trajectory of the centroid of multiple keypoints for a given individual. By default, the trajectory is colored by time (using the default colormap). Pass a different colormap through
cmapif desired. If a single keypoint is passed, the trajectory will be the same as the trajectory of the keypoint.- Parameters:
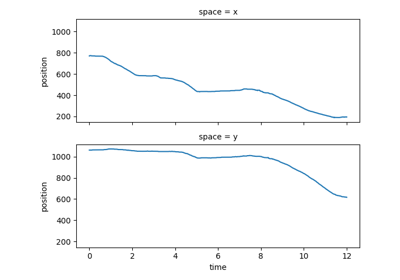
da (xr.DataArray) – A data array containing position information, with time and space as required dimensions. Optionally, it may have individuals and/or keypoints dimensions.
individual (str, optional) – The name of the individual to be plotted. By default, the first individual is plotted.
keypoints (str, list[str], optional) – The name of the keypoint to be plotted, or a list of keypoint names (their centroid will be plotted). By default, the centroid of all keypoints is plotted.
ax (matplotlib.axes.Axes or None, optional) – Axes object on which to draw the trajectory. If None, a new figure and axes are created.
**kwargs (dict) – Additional keyword arguments passed to
matplotlib.axes.Axes.scatter().
- Returns:
(figure, axes) – The figure and axes containing the trajectory plot.
- Return type:
tuple of (matplotlib.pyplot.Figure, matplotlib.axes.Axes)
Examples using plot_centroid_trajectory#
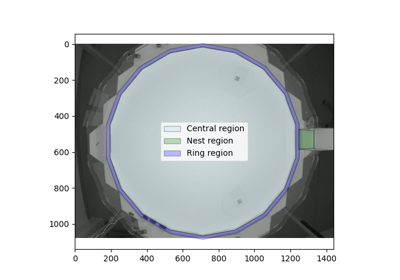
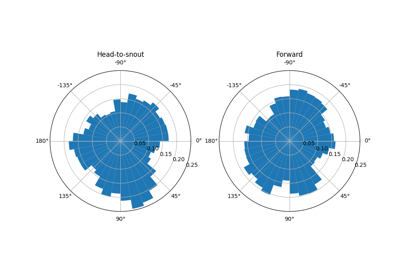
Compute distances and angles to regions of interest