Note
Go to the end to download the full example code. or to run this example in your browser via Binder
Extend your analysis methods along data dimensions#
Learn how to use the make_broadcastable decorator, to easily
cast functions across an entire xarray.DataArray.
Imports#
We will need numpy and xarray to make our custom data for this
example, and matplotlib to show what it contains.
We will be using the movement.utils.broadcasting module to
turn our one-dimensional functions into functions that work across
entire DataArray objects.
# For interactive plots: install ipympl with `pip install ipympl` and uncomment
# the following lines in your notebook
# %matplotlib widget
import matplotlib.pyplot as plt
import numpy as np
import xarray as xr

from movement import sample_data
from movement.plots import plot_centroid_trajectory
from movement.utils.broadcasting import make_broadcastable
Load Sample Dataset#
First, we load the SLEAP_three-mice_Aeon_proofread example dataset.
For the rest of this example we’ll only need the position data array, so
we store it in a separate variable.
ds = sample_data.fetch_dataset("SLEAP_three-mice_Aeon_proofread.analysis.h5")
positions: xr.DataArray = ds.position
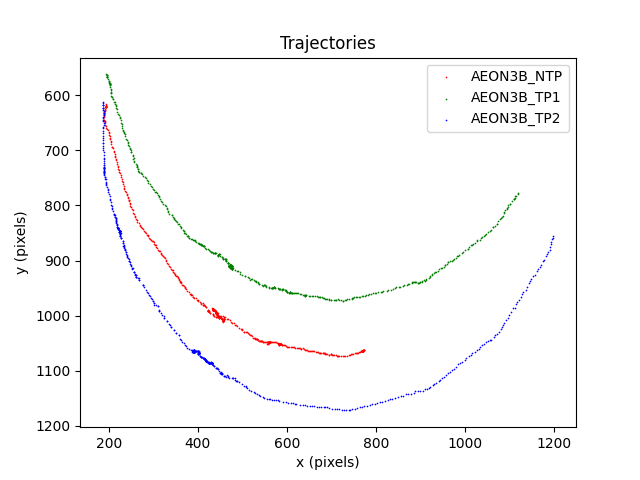
The individuals in this dataset follow very similar, arc-like trajectories. To help emphasise what we are doing in this example, we will offset the paths of two of the individuals by a small amount so that the trajectories are more distinct.
positions.loc[:, "y", :, "AEON3B_TP1"] -= 100.0
positions.loc[:, "y", :, "AEON3B_TP2"] += 100.0
fig, ax = plt.subplots(1, 1)
for mouse_name, col in zip(
    positions.individuals.values, ["r", "g", "b"], strict=False
):
    plot_centroid_trajectory(
        positions,
        individual=mouse_name,
        keypoints="centroid",
        ax=ax,
        linestyle="-",
        marker=".",
        s=2,
        linewidth=0.5,
        c=col,
        label=mouse_name,
    )
ax.invert_yaxis()
ax.set_title("Trajectories")
ax.set_xlabel("x (pixels)")
ax.set_ylabel("y (pixels)")
ax.legend()
<matplotlib.legend.Legend object at 0x7f1fb7fa3710>
Motivation#
Suppose that, during our experiment, we have a region of the enclosure that has a slightly wet floor, making it slippery. The individuals must cross this region in order to reach some kind of reward on the other side of the enclosure. We know that the “slippery region” of our enclosure is approximately rectangular in shape, and has its opposite corners at (400, 0) and (600, 2000), where the coordinates are given in pixels. We could then write a function that determines if a given (x, y) position was inside this “slippery region”.
def in_slippery_region(xy_position) -> bool:
    """Return True if xy_position is in the slippery region.

    Return False otherwise.
    xy_position has 2 elements, the (x, y) coordinates respectively.
    """
    # The slippery region is a rectangle with the following bounds
    x_min, y_min = 400.0, 0.0
    x_max, y_max = 600.0, 2000.0

    is_within_bounds_x = x_min <= xy_position[0] <= x_max
    is_within_bounds_y = y_min < xy_position[1] <= y_max
    return is_within_bounds_x and is_within_bounds_y


# We can just check our function with a few sample points
for point in [(0, 100), (450, 700), (550, 1500), (601, 500)]:
    print(f"{point} is in slippery region: {in_slippery_region(point)}")
(0, 100) is in slippery region: False
(450, 700) is in slippery region: True
(550, 1500) is in slippery region: True
(601, 500) is in slippery region: False
Determine if each position was slippery#
Given our data, we could extract whether each position (for each time-point, and each individual) was inside the slippery region by looping over the values.
data_shape = positions.shape
in_slippery = np.zeros(
    shape=(
        len(positions["time"]),
        len(positions["keypoints"]),
        len(positions["individuals"]),
    ),
    dtype=bool,
)  # We would save one result per time-point, per keypoint, per individual

# Feel free to comment out the print statements
# (line-by-line progress through the loop),
# if you are running this code on your own machine.
for time_index, time in enumerate(positions["time"].values):
    # print(f"At time {time}:")
    for keypoint_index, keypoint in enumerate(positions["keypoints"].values):
        # print(f"\tAt keypoint {keypoint}")
        for individual_index, individual in enumerate(
            positions["individuals"].values
        ):
            xy_point = positions.sel(
                time=time,
                keypoints=keypoint,
                individuals=individual,
            )
            was_in_slippery = in_slippery_region(xy_point)
            was_in_slippery_text = (
                "was in slippery region"
                if was_in_slippery
                else "was not in slippery region"
            )
            # print(
            #      "\t\tIndividual "
            #      f"{positions['individuals'].values[individual_index]} "
            #      f"{was_in_slippery_text}"
            # )
            # Save our result to our large array
            in_slippery[time_index, keypoint_index, individual_index] = (
                was_in_slippery
            )
We could then build a new DataArray to store our results, so that we can
access the results in the same way that we did our original data.
was_in_slippery_region = xr.DataArray(
    in_slippery,
    dims=["time", "keypoints", "individuals"],
    coords={
        "time": positions["time"],
        "keypoints": positions["keypoints"],
        "individuals": positions["individuals"],
    },
)

print(
    "Boolean DataArray indicating if at a given time, "
    "a given individual was inside the slippery region:"
)
was_in_slippery_region
Boolean DataArray indicating if at a given time, a given individual was inside the slippery region:
We could get the first and last time that an individual was inside the slippery region now, by examining this DataArray
i_id = "AEON3B_NTP"
individual_0_centroid = was_in_slippery_region.sel(
    individuals=i_id, keypoints="centroid"
)
first_entry = individual_0_centroid["time"][individual_0_centroid].values[0]
last_exit = individual_0_centroid["time"][individual_0_centroid].values[-1]
print(
    f"{i_id} first entered the slippery region at "
    f"{first_entry} and last exited at {last_exit}"
)
AEON3B_NTP first entered the slippery region at 2.1 and last exited at 8.64
Data Generalisation Issues#
The shape of the resulting DataArray is the same as our original
DataArray, but without the "space" dimension.
Indeed, we have essentially collapsed the "space" dimension, since our
in_slippery_region function takes in a 1D data slice (the x, y positions
of a single individual’s centroid at a given point in time) and returns a
scalar value (True/False).
However, the fact that we have to construct a new DataArray after running
our function over all space slices in our DataArray is not scalable - our
for loop approach relied on knowing how many dimensions our data had (and
the size of those dimensions). We don’t have a guarantee that the next
DataArray that comes in will have the same structure.
Making our Function Broadcastable#
To combat this problem, we can make the observation that given any
DataArray, we always want to broadcast our in_slippery_region
function
along the "space" dimension. By “broadcast”, we mean that we always want
to run our function for each 1D-slice in the "space" dimension, since
these are the (x, y) coordinates. As such, we can decorate our function with
the make_broadcastable decorator:
@make_broadcastable()
def in_slippery_region_broadcastable(xy_position) -> float:
    return in_slippery_region(xy_position=xy_position)
Note that when writing your own methods, there is no need to have both
in_slippery_region and in_slippery_region_broadcastable, simply apply
the make_broadcastable decorator to in_slippery_region directly.
We’ve made two separate functions here to illustrate what’s going on.
in_slippery_region_broadcastable is usable in exactly the same ways as
in_slippery_region was:
(0, 100) is in slippery region: False
(450, 700) is in slippery region: True
(550, 1500) is in slippery region: True
(601, 500) is in slippery region: False
However, in_slippery_region_broadcastable also takes a DataArray as
the first (xy_position) argument, and an extra keyword argument
broadcast_dimension. These arguments let us broadcast across the given
dimension of the input DataArray, treating each 1D-slice as a separate
input to in_slippery_region.
in_slippery_region_broadcasting = in_slippery_region_broadcastable(
    positions,  # Now a DataArray input
    broadcast_dimension="space",
)

print("DataArray output using broadcasting: ")
in_slippery_region_broadcasting
DataArray output using broadcasting:
Calling in_slippery_region_broadcastable in this way gives us a
DataArray output - and one that retains any information that was in our
original DataArray to boot! The result is exactly the same as what we got
from using our for loop, and then adding the extra information to the
result.
# Throws an AssertionError if the two inputs are not the same
xr.testing.assert_equal(
    was_in_slippery_region, in_slippery_region_broadcasting
)
But importantly, in_slippery_region_broadcastable also works on
DataArrays with different dimensions.
For example, we could have pre-selected one of our individuals beforehand.
i_id = "AEON3B_NTP"
individual_0 = positions.sel(individuals=i_id)

individual_0_in_slippery_region = in_slippery_region_broadcastable(
    individual_0,
    broadcast_dimension="space",
)

print(
    "We get a 3D DataArray output from our 4D input, "
    "again with the 'space' dimension that we broadcast along collapsed:"
)
individual_0_in_slippery_region
We get a 3D DataArray output from our 4D input, again with the 'space' dimension that we broadcast along collapsed:
Additional Function Arguments#
So far our in_slippery_region method only takes a single argument,
the xy_position itself. However in follow-up experiments, we might move
the slippery region in the enclosure, and so adapt our existing function to
make it more general.
It will now allow someone to input a custom rectangular region, by specifying
the minimum and maximum (x, y) coordinates of the rectangle, rather than
relying on fixed values inside the function.
The default region will be the rectangle from our first experiment, and we
still want to be able to broadcast this function.
And so we write a more general function, as below.
@make_broadcastable()
def in_slippery_region_general(
    xy_position, xy_min=(400.0, 0.0), xy_max=(600.0, 2000.0)
) -> bool:
    """Return True if xy_position is in the slippery region.

    Return False otherwise.
    xy_position has 2 elements, the (x, y) coordinates respectively.
    """
    x_min, y_min = xy_min
    x_max, y_max = xy_max
    is_within_bounds_x = x_min <= xy_position[0] <= x_max
    is_within_bounds_y = y_min <= xy_position[1] <= y_max
    return is_within_bounds_x and is_within_bounds_y


# (0.5, 0.5) is in the unit square whose bottom left corner is at the origin
print(in_slippery_region_general((0.5, 0.5), (0.0, 0.0), (1.0, 1.0)))
# But (0.5,0.5) is not in a unit square whose bottom left corner is at (1,1)
print(in_slippery_region_general((0.5, 0.5), (1.0, 1.0), (2.0, 2.0)))
True
False
We will find that make_broadcastable retains the additional arguments to
the function we define, however the xy_position argument has to be the
first argument to the function, that appears in the def statement.
# Default arguments should give us the same results as before
xr.testing.assert_equal(
    was_in_slippery_region, in_slippery_region_general(positions)
)
# But we can also provide the optional arguments in the same way as with the
# un-decorated function.
in_slippery_region_general(positions, xy_min=(100, 0), xy_max=(400, 1000))
Only Broadcast Along Select Dimensions#
The make_broadcastable decorator has some flexibility with its input
arguments, to help you avoid unintentional behaviour. You may have noticed,
for example, that there is nothing stopping someone who wants to use your
analysis code from trying to broadcast along the wrong dimension.
silly_broadcast = in_slippery_region_broadcastable(
    positions, broadcast_dimension="time"
)

print("The output has collapsed the time dimension:")
silly_broadcast
The output has collapsed the time dimension:
There is no error thrown because functionally, this is a valid operation.
The time slices of our data were 1D, so we can run in_slippery_region on
them. But each slice isn’t a position, it’s an array of one spatial
coordinate (EG x) for each keypoint, each individual, at every time! So from
an analysis standpoint, doing this doesn’t make sense and isn’t how we intend
our function to be used.
We can pass the only_broadcastable_along keyword argument to
make_broadcastable to prevent these kinds of mistakes, and make our
intentions clearer.
@make_broadcastable(only_broadcastable_along="space")
def in_slippery_region_space_only(xy_position):
    return in_slippery_region(xy_position)
Now, in_slippery_region_space_only no longer takes the
broadcast_dimension argument.
try:
    in_slippery_region_space_only(
        positions,
        broadcast_dimension="time",
    )
except TypeError as e:
    print(f"Got a TypeError when trying to run, here's the message:\n{e}")
Got a TypeError when trying to run, here's the message:
__main__.in_slippery_region_space_only() got multiple values for keyword argument 'broadcast_dimension'
The error we get seems to be telling us that we’ve tried to set the value of
broadcast_dimension twice. Specifying
only_broadcastable_along = "space" forces broadcast_dimension to be
set to "space", so trying to set it again (even to to the same value)
results in an error.
However, in_slippery_region_space_only knows to only use the "space"
dimension of the input by default.
was_in_view_space_only = in_slippery_region_space_only(positions)

xr.testing.assert_equal(
    in_slippery_region_broadcasting, was_in_view_space_only
)
It is worth noting that there is a “helper” decorator,
space_broadcastable, that essentially does the same thing as
make_broadcastable(only_broadcastable_along="space").
You can use this decorator for your own convenience.
Extending to Class Methods#
make_broadcastable can also be applied to class methods, though it needs
to be told that you are doing so via the is_classmethod parameter.
class Rectangle:
    """Represents an observing camera in the experiment."""

    xy_min: tuple[float, float]
    xy_max: tuple[float, float]

    def __init__(self, xy_min=(0.0, 0.0), xy_max=(1.0, 1.0)):
        """Create a new instance."""
        self.xy_min = tuple(xy_min)
        self.xy_max = tuple(xy_max)

    @make_broadcastable(is_classmethod=True, only_broadcastable_along="space")
    def is_inside(self, /, xy_position) -> bool:
        """Whether the position is inside the rectangle."""
        # For the sake of brevity, we won't redefine the entire method here,
        # and will just call our existing function.
        return in_slippery_region_general(
            xy_position, self.xy_min, self.xy_max
        )


slippery_region = Rectangle(xy_min=(400.0, 0.0), xy_max=(600.0, 2000.0))
was_in_region_clsmethod = slippery_region.is_inside(positions)

xr.testing.assert_equal(
    was_in_region_clsmethod, in_slippery_region_broadcasting
)
The broadcastable_method decorator is provided as a helpful alias for
make_broadcastable(is_classmethod=True), and otherwise works in the same
way (and accepts the same parameters).
class RectangleAlternative:
    """Represents an observing camera in the experiment."""

    xy_min: tuple[float, float]
    xy_max: tuple[float, float]

    def __init__(self, xy_min=(0.0, 0.0), xy_max=(1.0, 1.0)):
        """Create a new instance."""
        self.xy_min = tuple(xy_min)
        self.xy_max = tuple(xy_max)

    @make_broadcastable(is_classmethod=True, only_broadcastable_along="space")
    def is_inside(self, /, xy_position) -> bool:
        """Whether the position is inside the rectangle."""
        # For the sake of brevity, we won't redefine the entire method here,
        # and will just call our existing function.
        return in_slippery_region_general(
            xy_position, self.xy_min, self.xy_max
        )


slippery_region_alt = RectangleAlternative(
    xy_min=(400.0, 0.0), xy_max=(600.0, 2000.0)
)
was_in_region_clsmethod_alt = slippery_region.is_inside(positions)

xr.testing.assert_equal(
    was_in_region_clsmethod_alt, in_slippery_region_broadcasting
)

xr.testing.assert_equal(was_in_region_clsmethod_alt, was_in_region_clsmethod)
In fact, if you look at the Regions of Interest submodule, and in particular
the classes inside it, you’ll notice that we use the broadcastable_method
decorator ourselves in some of these methods!
Total running time of the script: (0 minutes 1.105 seconds)